Getting 1% Better Every Day
What is a good strategy for improvement? You can either a) improve incrementally day over day or b) improve dramatically in spurts and stay flat otherwise.
Assume you start on some arbitrary scale at 1.
Option A)
You get 1% better on Z% of days, where Z can take on values from 0 to 100. At year $t$, your value given that you begin at 1 will be $1.01^{365 \cdot t \cdot \frac{Z}{100}}$. Given this, we can visualize your value at 6 months, 1 year, and 5 years as a function of Z:
library(tidyverse)

level <- function(n_years, fraction_improved, rate_improvement = 0.01){

	days_in_year <- 365
	(1 + rate_improvement)^(fraction_improved*365*n_years)

}

z <- seq(0, 1, 0.05)

half_year <- data.frame(level = unlist(lapply(z, function(x) level(0.5, x))), time = "0.5y", z = z)
one_year <- data.frame(level =unlist(lapply(z, function(x) level(1, x))), time = "1y", z = z)
five_year <- data.frame(level =unlist(lapply(z, function(x) level(5, x))), time = "5y", z = z)

df <- rbind(half_year, one_year, five_year) %>% as_tibble()

cpal <- palette.colors(palette = "Okabe-Ito") %>% unname()

(ggplot(df, aes(x=z, y=log(level), color = time, fill = time)) + theme_bw() + geom_point(size = 3, alpha = 0.5) + xlab("Fraction of Days Improved") + ylab("log(Improvement)") + theme_bw() + theme(panel.grid.minor=element_blank(), panel.grid.major = element_blank()) + theme(axis.text = element_text(size=12), axis.title=element_text(size=16), legend.text=element_text(size=10), legend.title=element_text(size=14), plot.title=element_text(size=18, hjust=0.5)) + geom_hline(yintercept = 0, linetype = "dashed", color = "grey70") + geom_hline(yintercept = log(5), linetype = "dashed", color = "black") + geom_text(aes(x=0.05, y = log(6.4)), label = "5x", size = 3, color = "black") + geom_hline(yintercept = log(10), linetype = "dashed", color = "black") + geom_text(aes(x=0.05, y = log(13)), label = "10x", size = 3, color = "black") + geom_hline(yintercept = log(100), linetype = "dashed", color = "black") + geom_text(aes(x=0.05, y = log(130)), label = "100x", size = 3, color = "black") + scale_color_manual(name = "Time", values = cpal[2:4]) + scale_fill_manual(name = "Time", values = cpal[2:4]) + ggtitle("Incremental Growth"))
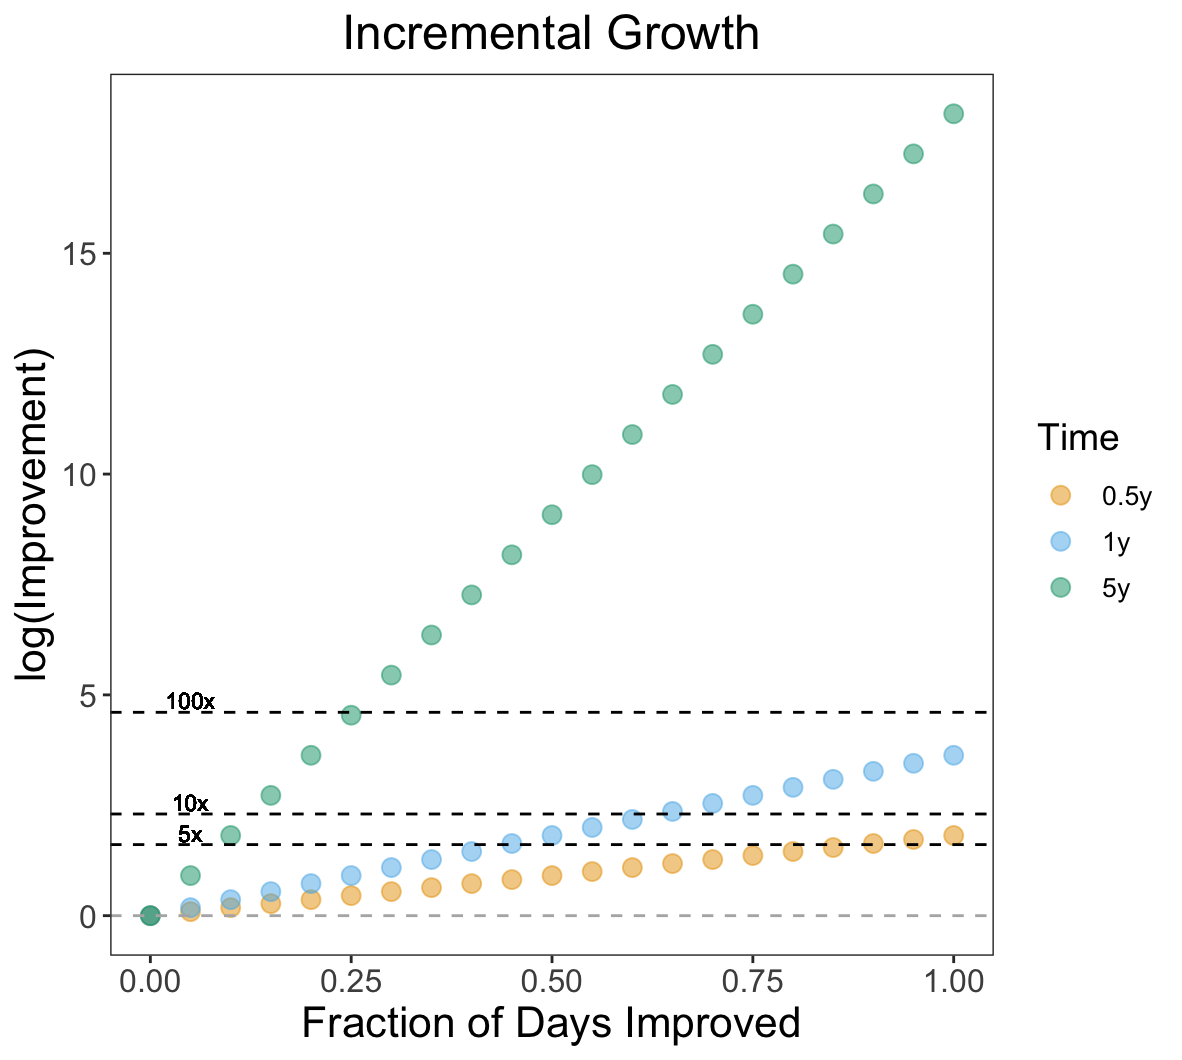
Improving every day for a half year and year leads to a 6x and 37x increase from baseline respectively. Small gains continuously compounded make a big difference.
Even improving on just 80% of days by 1% leads to a 5x increase from baseline in a half year. In 1 year, this is a 18x increase from baseline. This translates to improving on 24 out of 30 days - 6 non-improvement days per month. If you improve 5 days a week, for a half year, at 1%, that translates to a 3.65x increase from baseline.
Option B)
You grow in spurts with periods of rapid growth and the rest of the time staying flat. Suppose during these spurts you get 5% better each day for a short number of days and stay flat otherwise. At year $t$, your value is $1.05^{365 \cdot t \cdot \frac{Z}{100}}$. Z can technically be any number from 0 to 100 but since we are working in spurts, it is likely to be constrained to the lower end of that interval - somewhere between 0 and, at absolute maximum, 20.
library(tidyverse)

z <- seq(0, 0.2, 0.02)

half_year <- data.frame(level = unlist(lapply(z, function(x) level(0.5, x, 0.05))), time = "0.5y", z = z)
one_year <- data.frame(level =unlist(lapply(z, function(x) level(1, x, 0.05))), time = "1y", z = z)
five_year <- data.frame(level =unlist(lapply(z, function(x) level(5, x, 0.05))), time = "5y", z = z)

df <- rbind(half_year, one_year, five_year) %>% as_tibble()

cpal <- palette.colors(palette = "Okabe-Ito") %>% unname()

(ggplot(df, aes(x=z, y=log(level), color = time, fill = time)) + theme_bw() + geom_point(size = 3, alpha = 0.5) + xlab("Fraction of Days Improved") + ylab("log(Improvement)") + theme_bw() + theme(panel.grid.minor=element_blank(), panel.grid.major = element_blank()) + theme(axis.text = element_text(size=12), axis.title=element_text(size=16), legend.text=element_text(size=10), legend.title=element_text(size=14), plot.title=element_text(size=18, hjust=0.5)) + geom_hline(yintercept = 0, linetype = "dashed", color = "grey70") + geom_hline(yintercept = log(5), linetype = "dashed", color = "black") + geom_text(aes(x=0.05, y = log(6.4)), label = "5x", size = 3, color = "black") + geom_hline(yintercept = log(10), linetype = "dashed", color = "black") + geom_text(aes(x=0.05, y = log(13)), label = "10x", size = 3, color = "black") + geom_hline(yintercept = log(100), linetype = "dashed", color = "black") + geom_text(aes(x=0.05, y = log(130)), label = "100x", size = 3, color = "black") + scale_color_manual(name = "Time", values = cpal[2:4]) + scale_fill_manual(name = "Time", values = cpal[2:4]) + ggtitle("Growth in Spurts"))
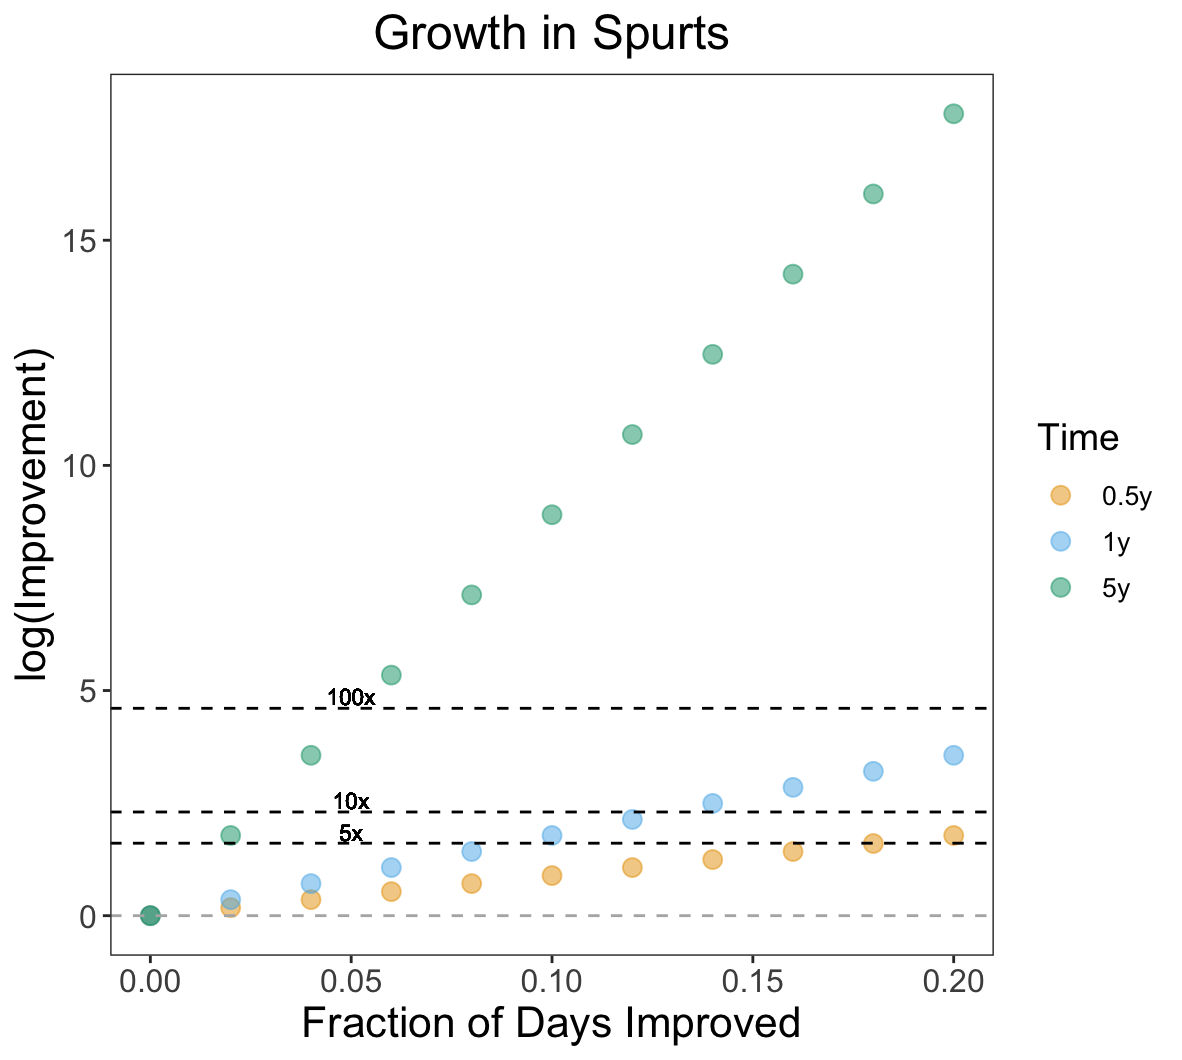
In a year, improving in spurts on 20% of days results in a 35x increase from baseline - roughly the same as a 1% improvement on 100% of days. In a half year, improving on at least 18% of days translates to a 5x increase from baseline. This translates, roughly, 6 days a month on average of 5% improvements. This is a large ask. Consider that staying flat or maintainence takes energy and effort too and this becomes that much harder. Basically, on weekends you must accelerate yourself 5% week over week.
There are, of course, places where sprints of work are necessary and possible preferable, but never at the expense of consistent improvement. On the whole, getting incrementally better and putting in the effort over time especially when things seem not to be going your way is the most important long-term factor in improving yourself.
This data suggests that we should strive for small consistent gains. Even if we only improve by 1% on 80% of days, that compounds to a large increase over baseline in the long-term. Routine and discpline allow this to become a reality.
There are things you can control and things you cannot control. It is important to consistently improve at the things you can control. You can control the effort you put into your physical health, research, and mental health for example. On the flip side, for example, you cannot control other people or outcomes.